ListBurst: Powerful Charts & Dashboards for SharePoint
Unlock the value of your Microsoft data.
Create interactive business intelligence dashboards in minutes, not hours.
Unlock the value of your Microsoft data.
Create interactive business intelligence dashboards in minutes, not hours.
ListBurst is for everyone - simple to implement, yet powerful, with advanced features at a great price”
- Mark Adams, Simpatica GroupNo payment information needed to start your free trial.

Powerful tools to transform your SharePoint data into actionable insights
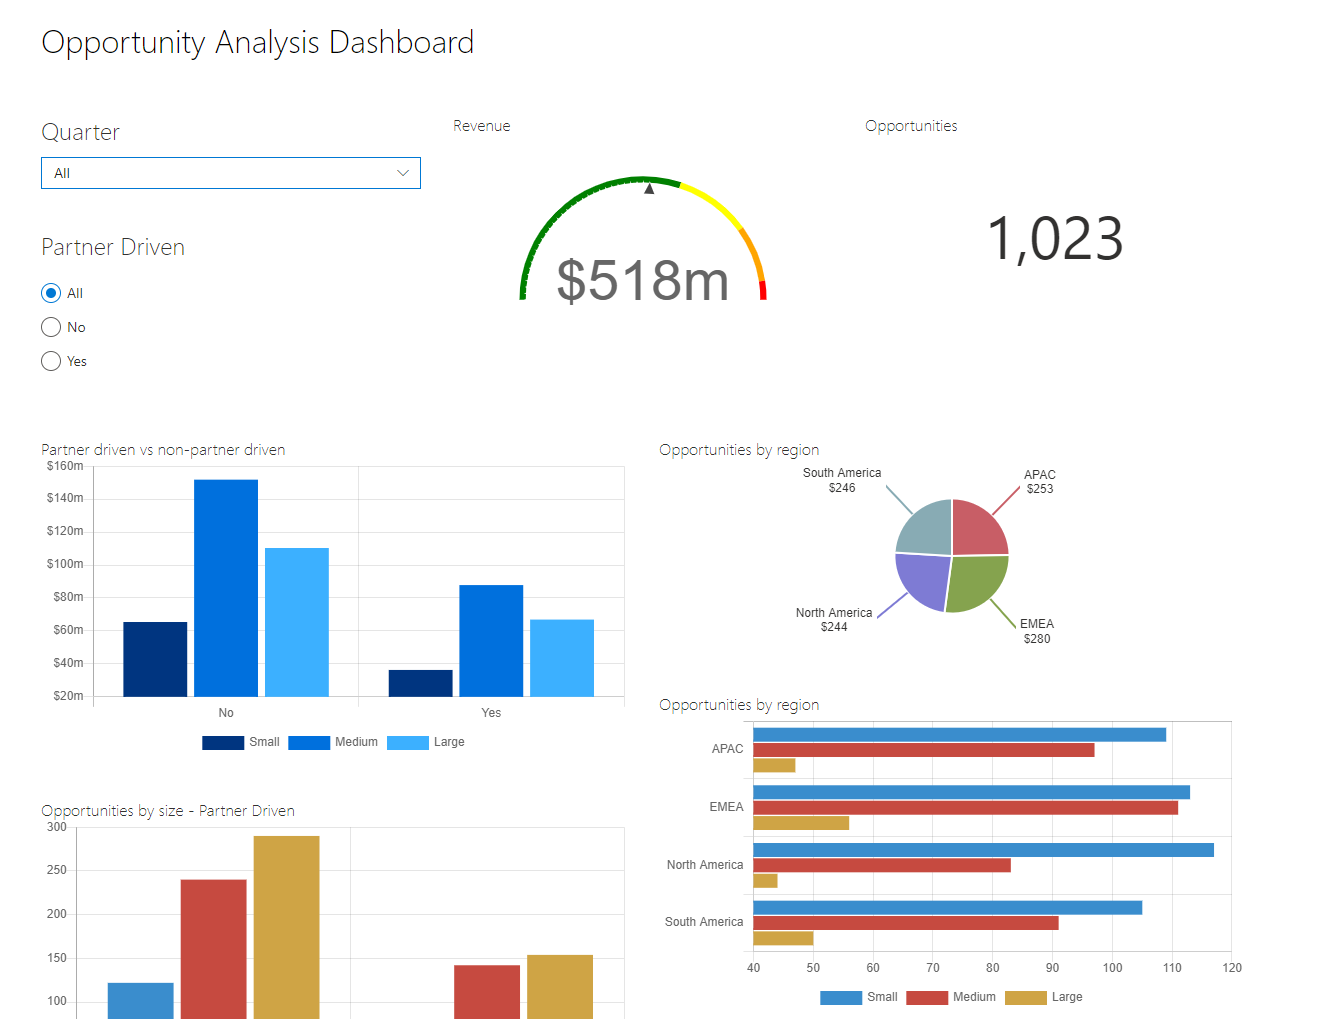
Add drill-down filter fields to the page with the Filter web part. Connection to charts on the page is automatic and updates are seamless across all your team's users.
Our filtering function requires almost no configuration and no coding - simply select the field to filter on.
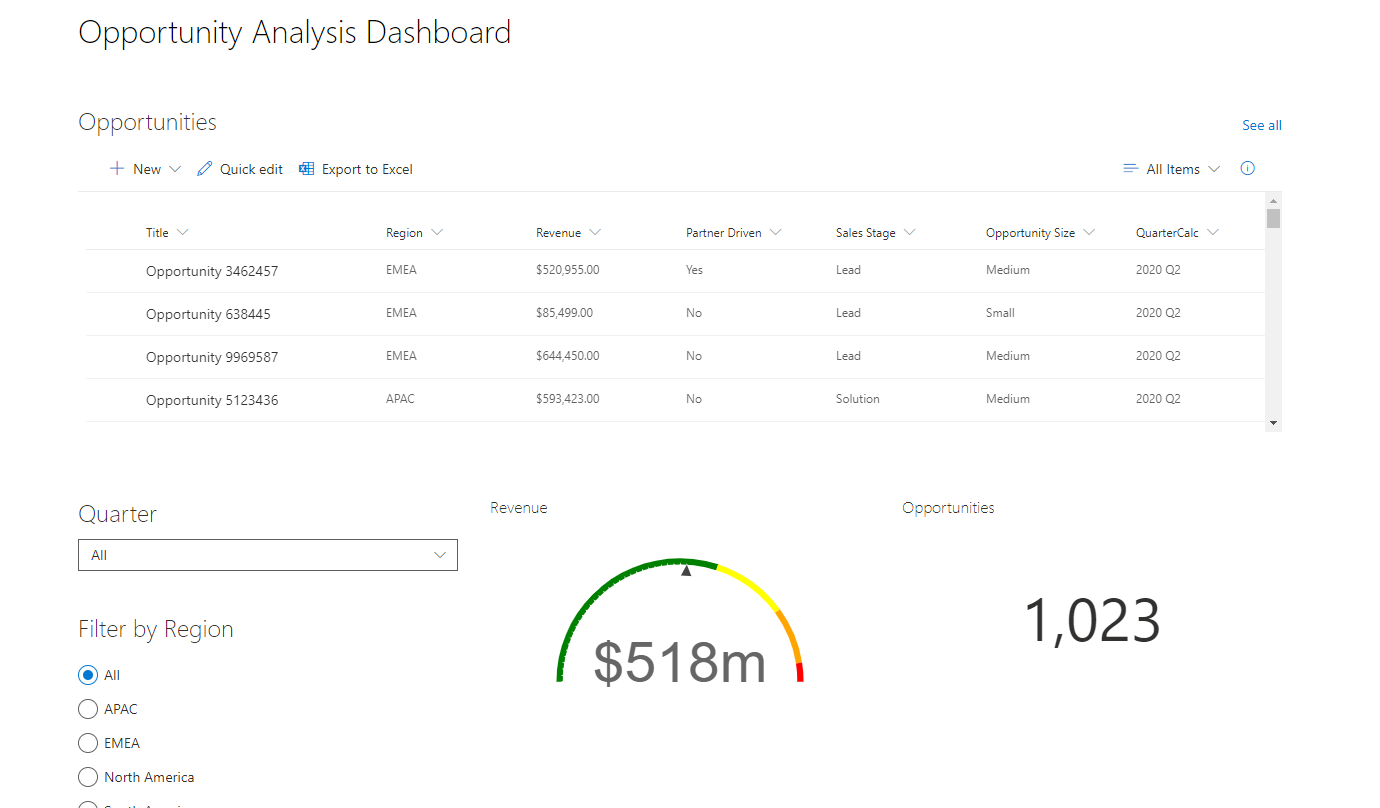
No two ListBurst dashboards are the same – create something truly tailored to your needs. Build a modern SharePoint Page using your selection of web parts.
Need to aggregate your data? No problem. Fine-tune your data with powerful data aggregation and filtering options. Select a list view to display, and easily apply grouping and aggregation to the data.
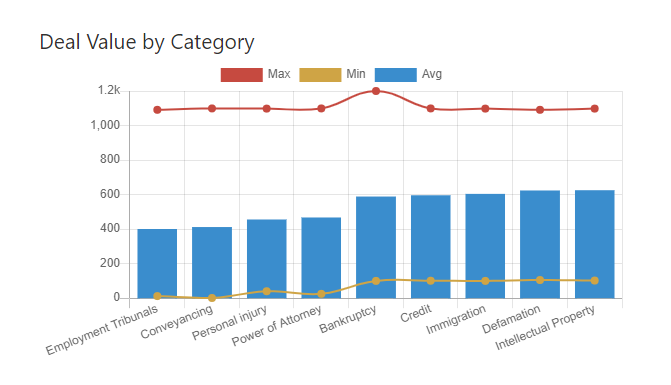
Combine multiple series on to a single chart.
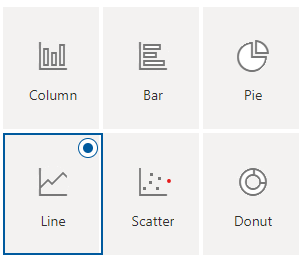
Creating data visualizations couldn't be simpler - add the web part, choose the data source, select your chart type and it'll render immediately on your page.
No custom code, no complex configuration. Business users of every technical ability and skillset can take control over design and maintenance of the dashboard as requirements evolve.
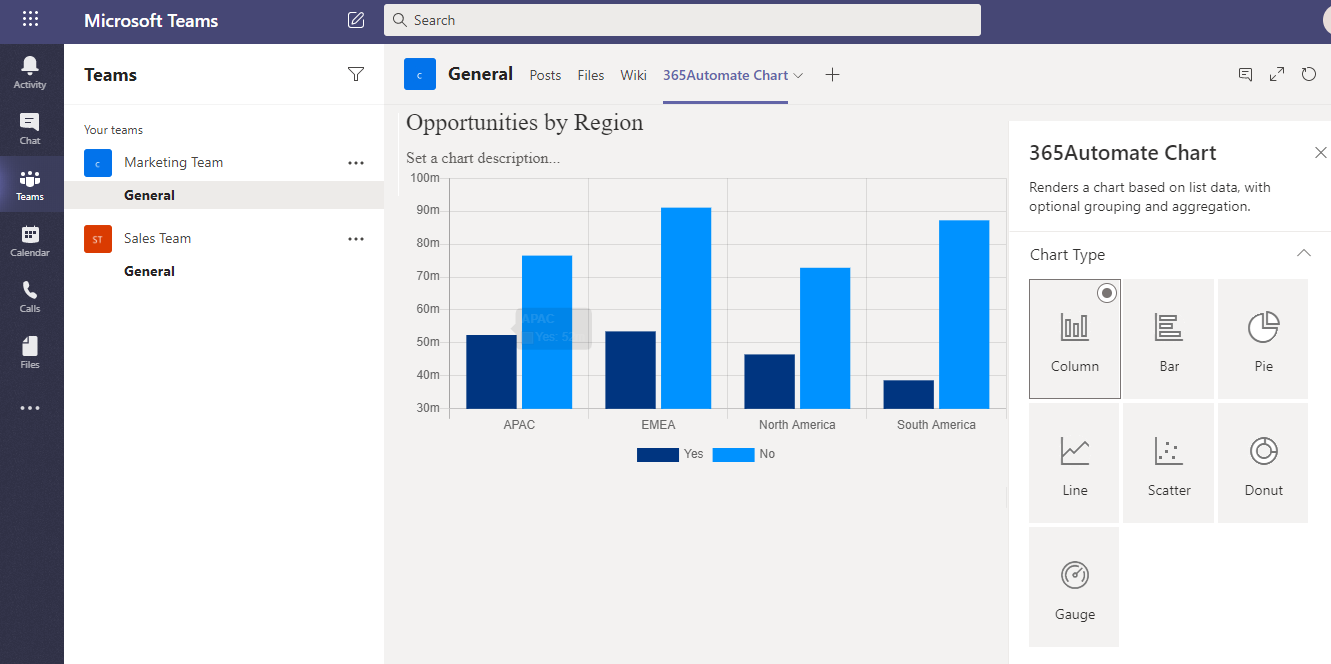
We're always adding new features, and we're delighted to roll out this popular addition. Add a Teams Chart Tab natively, or embed a full SharePoint page dashboard within Teams.
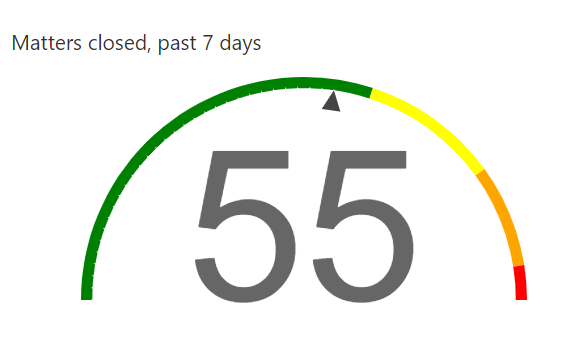
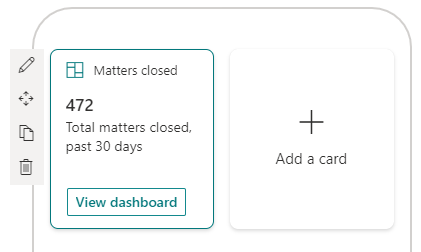
Includes a Viva Connections web part. Display KPIs within Viva and link to the full dashboard for deeper insights.
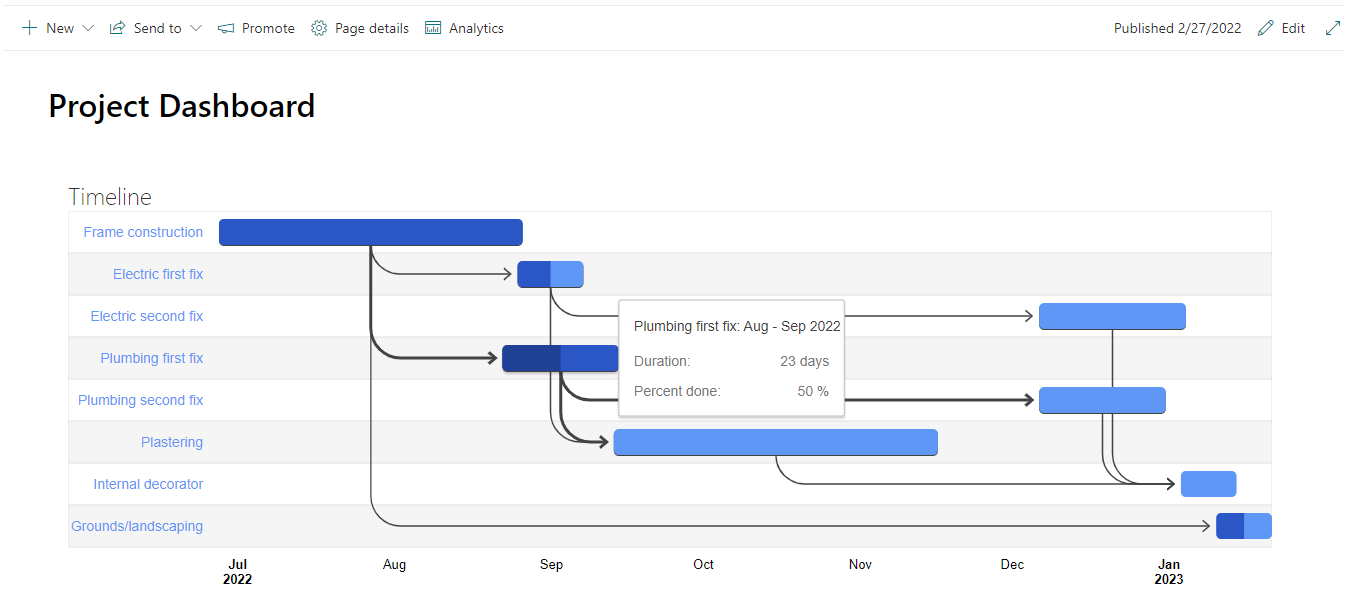
Includes a basic Gantt chart for project timeline visualization. For more advanced Gantt charts see our dedicated Gantt solution.
Our licence grants unlimited usage to the whole SharePoint tenant - meaning you don't need to worry about the number of individual users.
Try the product for yourself with our 30 day trial.
A license is required to continue usage after initial 30-day trial period.
Payment can be made either via credit card or via purchase order.

Annual subscription license
Technical support, hotfixes & upgrades
£1095 / $1295 / €1195
per year
Flexible payment options
Alternative currencies available
Purchase order/invoice payment
Large organization pricing
Small team discounts
Contact Us
for pricing
Large organizations (over 500 users) - please contact us to confirm usage and pricing
Enquire about the Small Team discount when there are less than 10 viewers.