
Everything in this post uses out-of-the-box Microsoft 365 functionality, except for the charting component, which is powered by 365Automate. There’s a free 30-day trial, so try it out today!
Building a reporting solution can seem like a daunting task. There are considerations around secure data storage, the survey interface (form) which end-users must have anonymous access to, and building out a dashboard to expose patterns in the data. Fortunately, the Microsoft 365 platform provides a number of technologies which can accomplish these use cases.
During this process, we’ll see how to:
Gathering KPIs (Key Performance Indicators) and understanding their patterns needn’t be a difficult task. Let’s build out the solution.
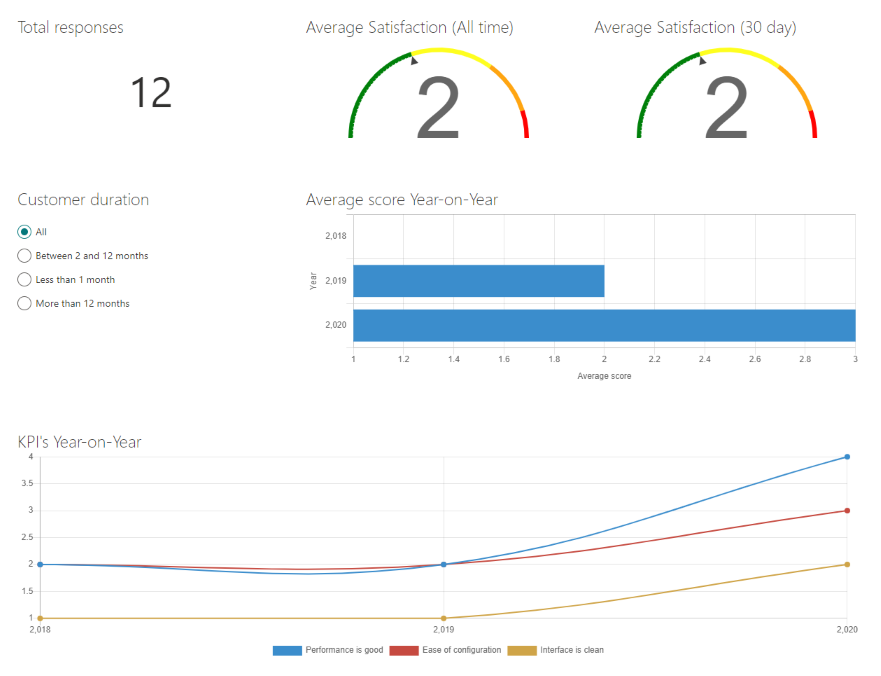
Here’s an idea of what we’ll be building:
When I’m starting a new project, the first place I always start is with the user experience. For this reason, we’ll start with Microsoft Forms. Although this is inspired by a real-life customer project, we’re going to build out a fictional scenario - a really common Customer Satisfaction Survey.
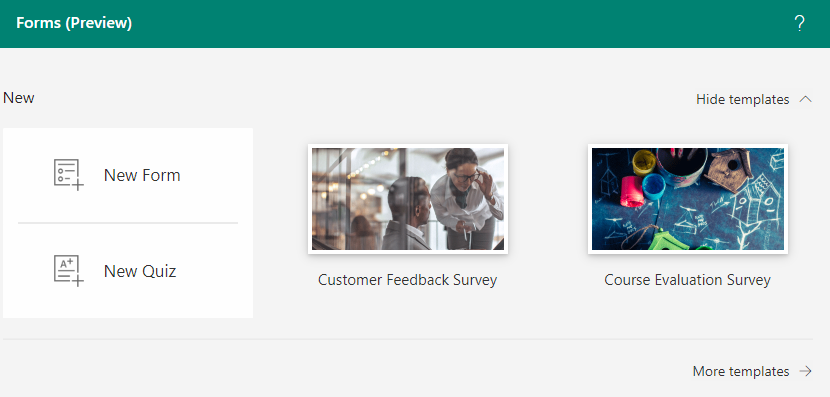
Visit forms.office.com. You can either build out a custom form (New Form) or select one of the available templates (currently preview only):
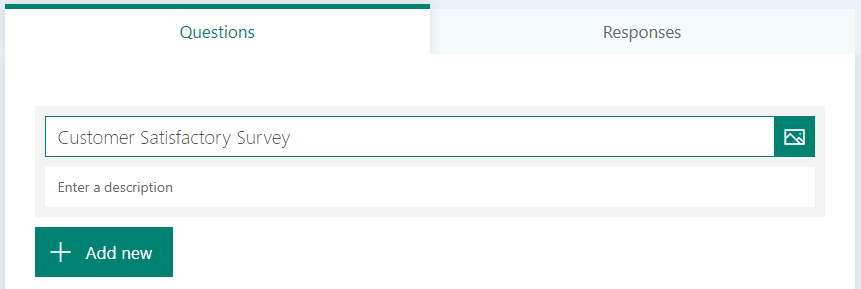
In my case, I’m starting with a blank form. Give it a title, and click Add New to add the first field:
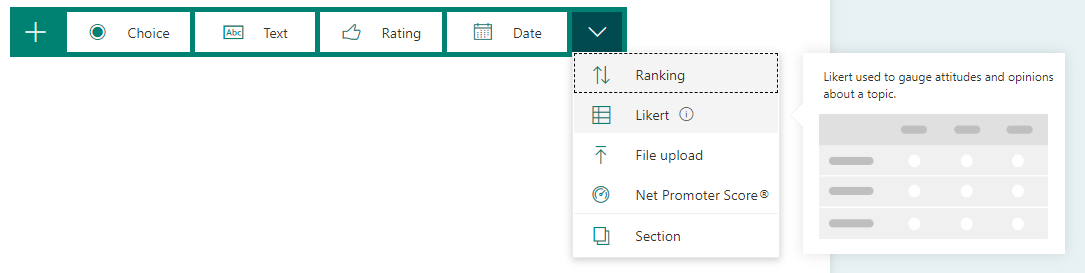
Clicking Add New gives you 4 field options, but the drop-down button at the end reveals a few really useful feedback fields. It’s almost as though forms was designed specifically for customer feedback!
I’ll give a quick summary of the fields. Skip this if you’re already familiar with Forms and its fields.
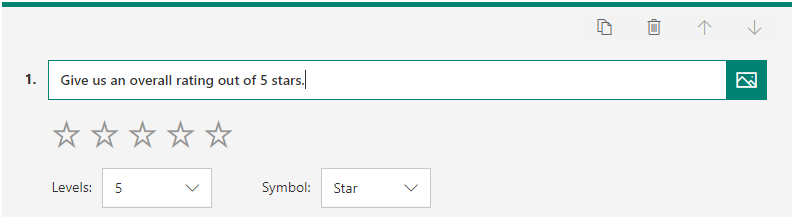
Choice, Text and Date are obvious so I won’t go into those. Rating gives a line of stars where the user can select a ‘score’:
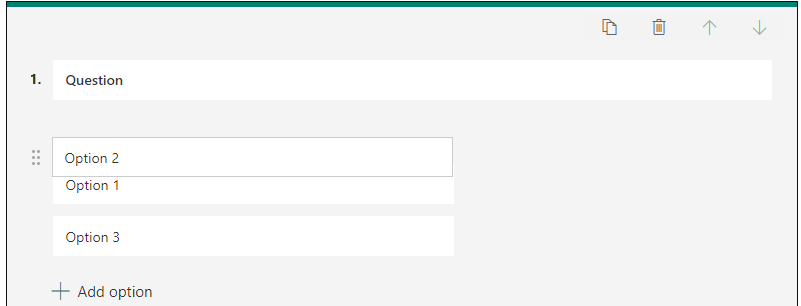
Ranking allows you to enter some options, and the user will then have the ability to re-order them:
Likert is a pretty powerful field - it presents a table of statements, where the user can select an option for each:
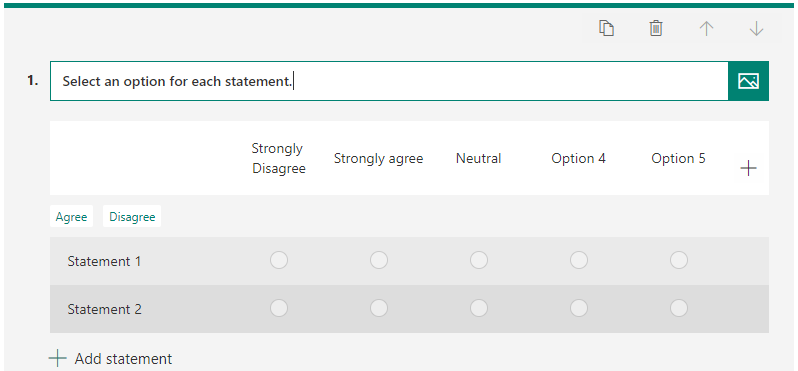
Of course, this looks pretty good for a feedback form.
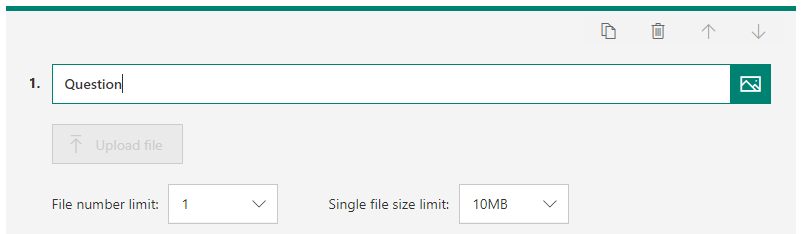
The next field is File upload - this is fairly self explanatory and allows the user to upload a file attachment with their response.
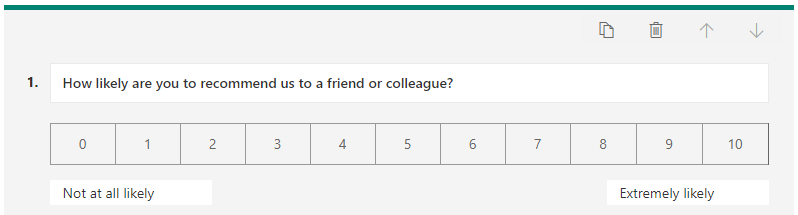
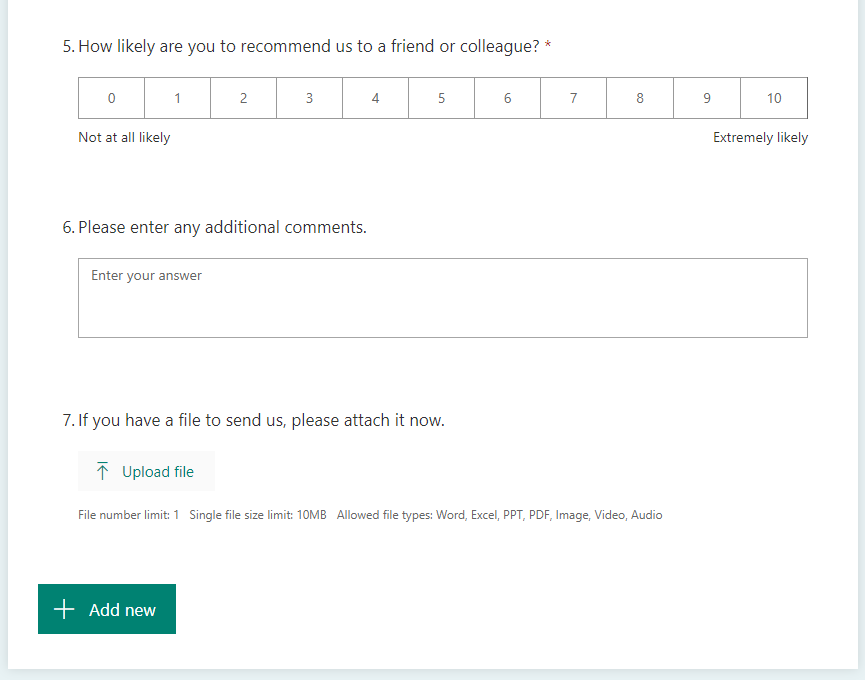
The final field is another useful one, the Net Promoter Score:
…which appears like this…
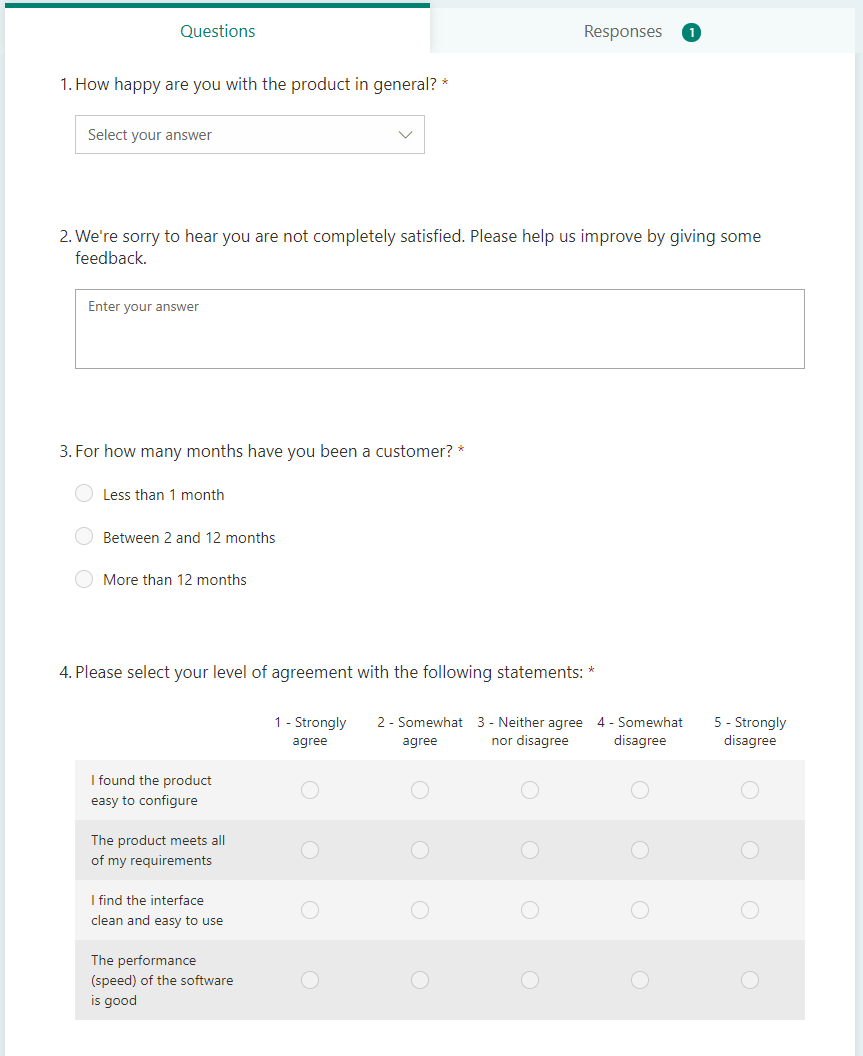
The information I want to gather in my form is as follows:
Note that File Upload is only available when the Form is restricted to those within your organisation. If you want your form to be accessible publicly, then don’t add a File Upload field, and update the Who can fill in this form option under Settings to Anyone with the link.
Now that we have a list of questions and their field types, we can build it out.
The Branching requirement (to only show the text input field - question 2) - can only be configured after we’ve added all dependent fields, so we’ll add the branching at the end!
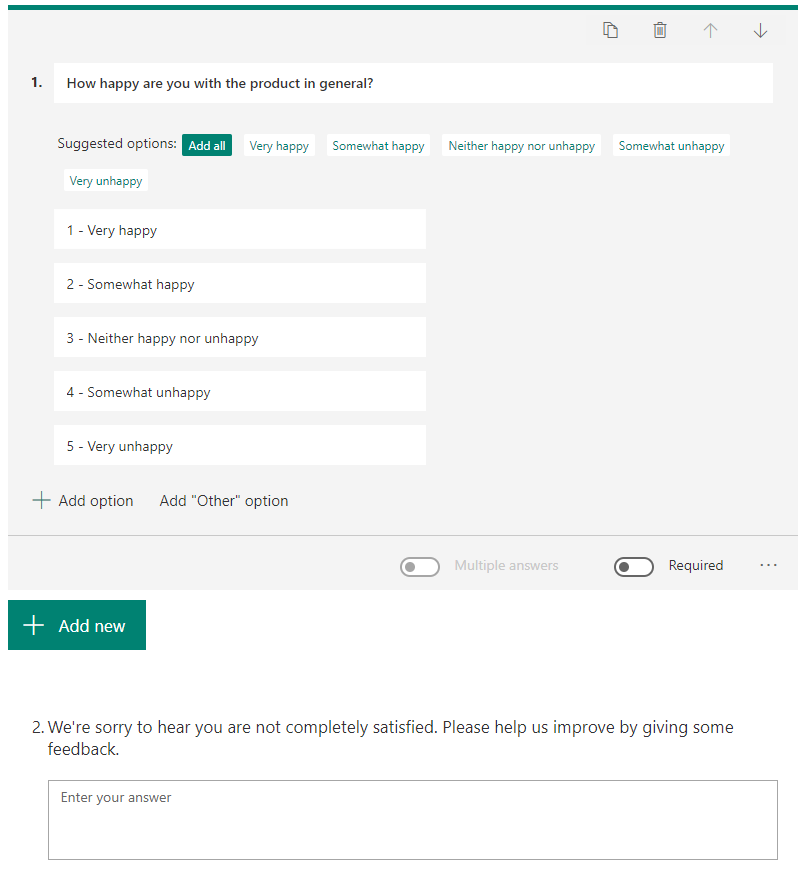
Question One will look like this, being a Choice field:
However, we only want to show the text field if they select options 4-5. To do this, select the Add Branching option
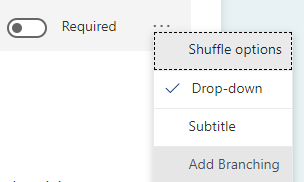
The branching is then configured as follows:
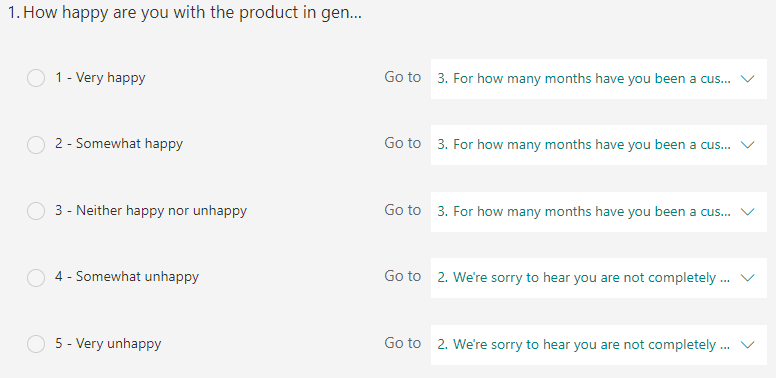
Note that the choice fields above have the number at the start (Eg. 1 - Very happy). The reason for this is that we can use the leading integer to perform numerical analysis eg. average calculations - later on.
The completed form looks like this:
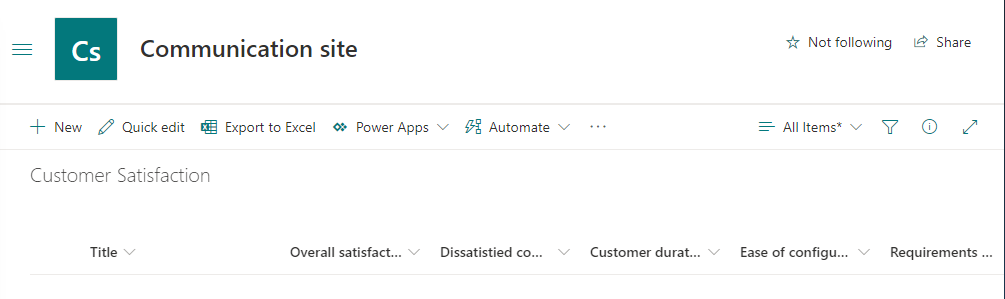
Next, we’re going to build the SharePoint List to store all the Form responses.
This bit isn’t too challenging. We’ll create a List with a field to correspond to each Form field, and several additional fields to store a numerical representation of the responses.
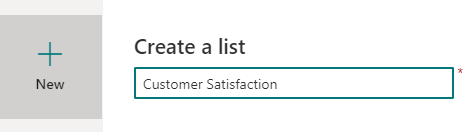
Start with a blank List.
In your List, click Add column and add each of the following columns:
=YEAR(Created)&" Q"&CHOOSE(MONTH(Created),1,1,1,2,2,2,3,3,3,4,4,4)The attachment isn’t necessary since list items already support attachments.
You will note that the fields above are mostly single lines of text fields. The reason for this is simplicity - we could make them Choice fields, but then the choices have to line up with those in the Form. Also, we get to store the exact text that the user selected, and if it’s changed in the Form later, that will be recorded. We’ll use Flow to get a numerical representation of each answer and store it in a corresponding number field for the purposes of statistical analysis.
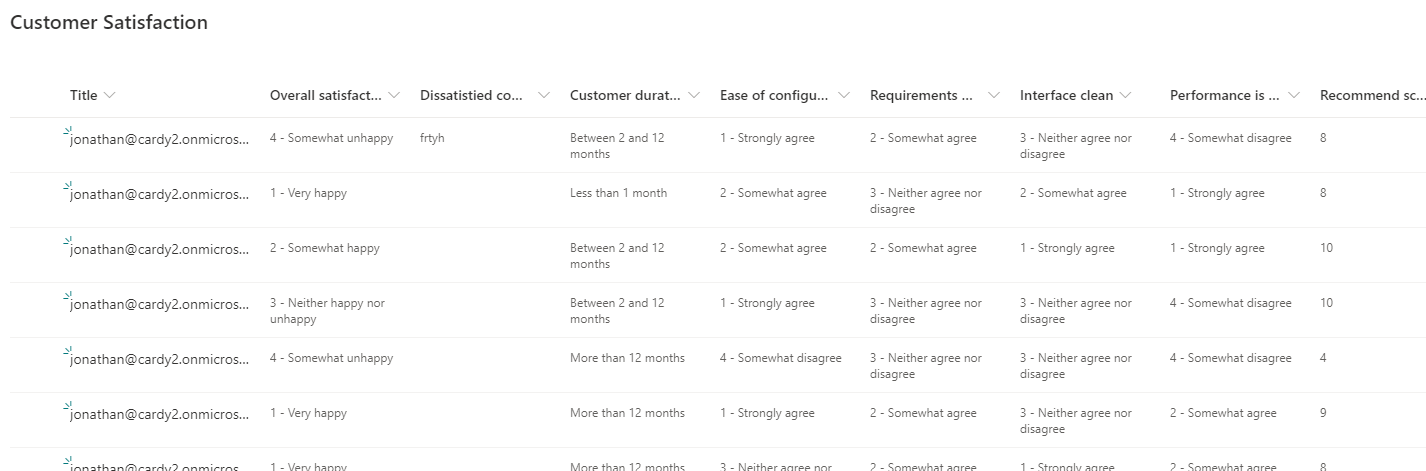
The completed list looks like this. Not all fields are visible here but you get the idea:
To connect the Form to our SharePoint List, we’ll need to use PowerAutomate.
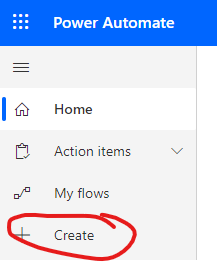
Navigate to flow.microsoft.com and click Create
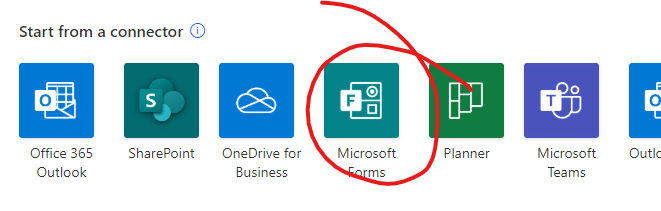
In the ‘Create a new Flow page’ you’ll see an option to start from a connector. This is a convenient way to create a flow triggered from a Form. Click it:
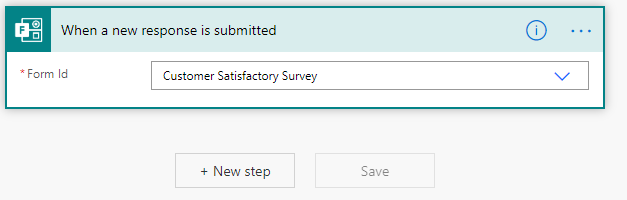
Select the trigger:
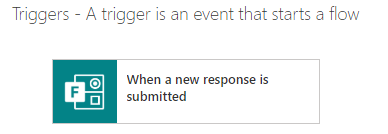
Select the forms Survey and then click New Step:
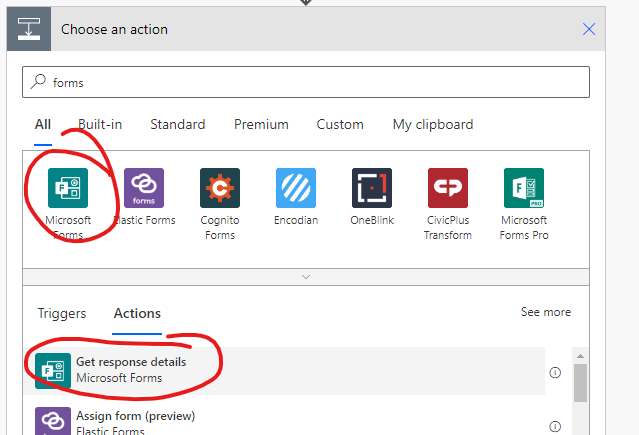
In the New Step dialog, search for Forms and select Get response details:
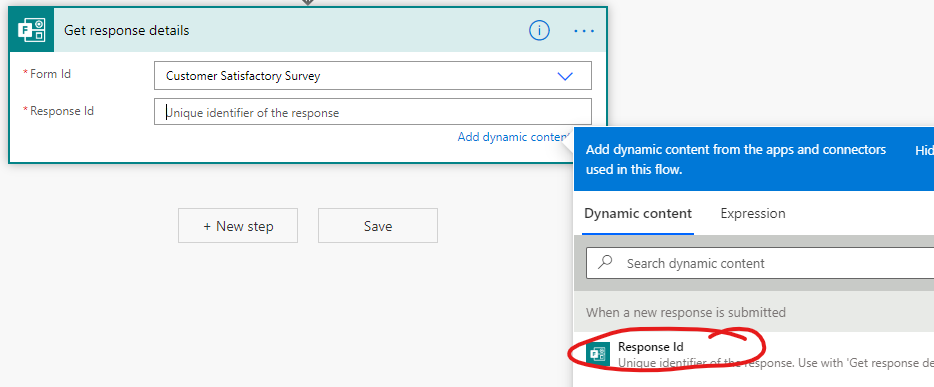
In the Get response details step, select the form, and then click on the Response Id field and select Response Id in the dynamic content popup:
The next steps is to convert the text responses to numerical values. This can be done by creating a variable and extracting the first digit from the response. This is why we formatted the answers with a number at the beginning of the process (eg. 1 - Very happy).
We could be extracting this numerical value using a SharePoint Calculated field. However, calculated fields don’t allow filtering with >5k items, and can’t be aggregated.
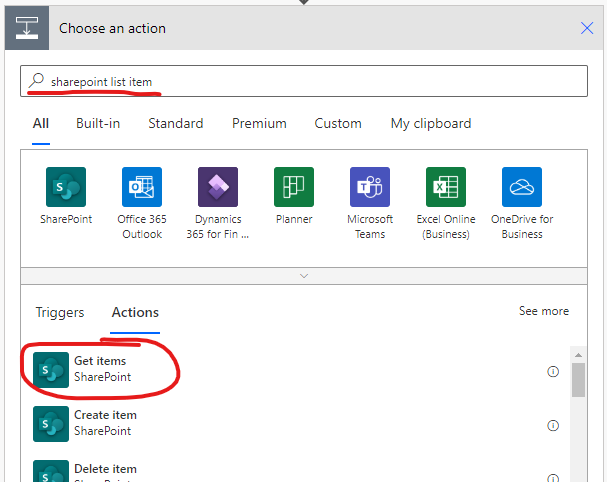
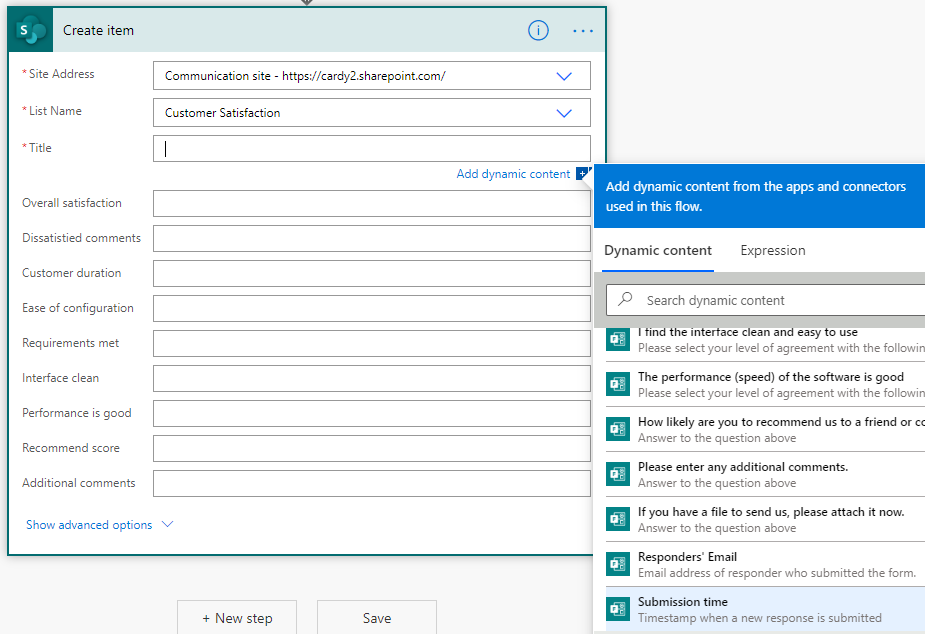
Once again, click New Step. This time add the SharePoint Create item step:
Select the SharePoint List that we created earlier. Once you do, it’ll populate automatically with the fields we created. This next bit is oddly satisfying. Just click on each field, and select the appropriate Form field. For Title, we’re going to store the respondent’s email address:
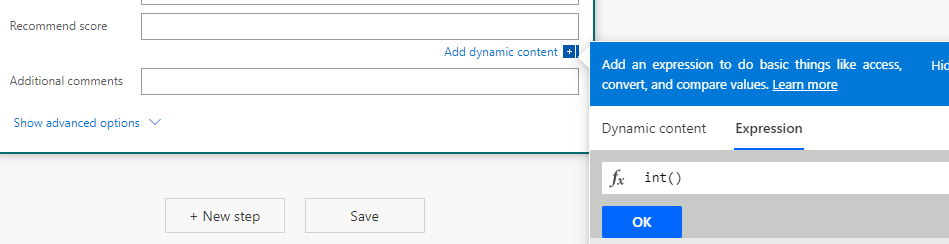
An awkward one is the Recommend score. Since it’s a number, it requires a bit of special formatting. When the field is selected, click Expression, and type the int() function:
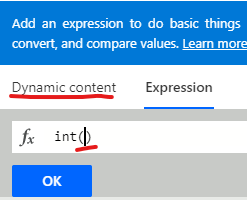
Then, place the cursor between the parentheses, and click Dynamic content:
Then you can select the Form field:
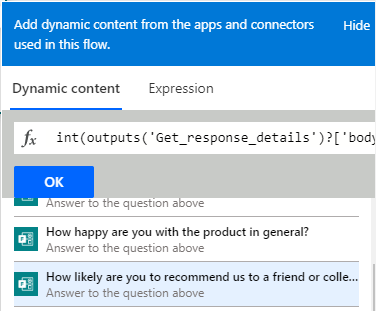
It will then populate the field correctly, formatting it as a number for your SharePoint Number field.
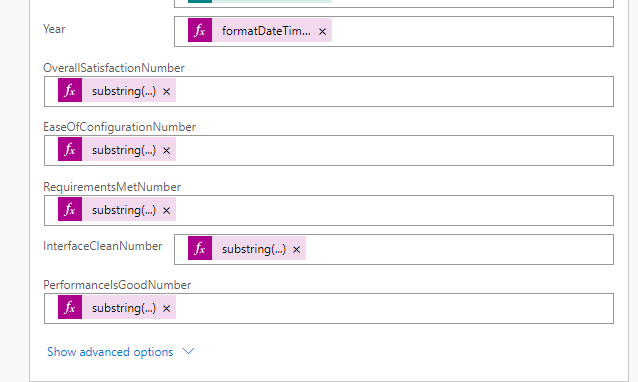
For the Year field, insert the following expression: formatDateTime(utcNow(),'yyyy').
For the fields OverallSatisfactionNumber, EaseOfConfigurationNumber, RequirementsMetNumber, InterfaceCleanNumber, and PerformanceIsGoodNumber, you’ll have to insert a substring formula. To do this, select the field, and select Expression and type substring():
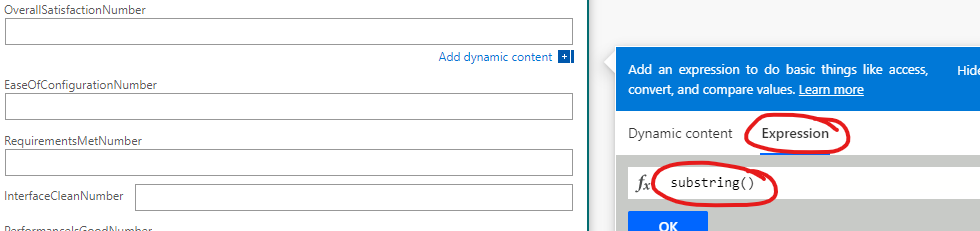
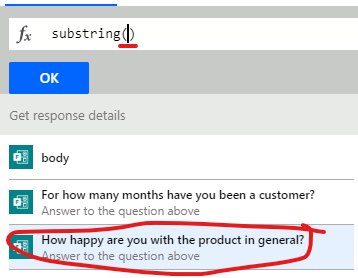
Click in between the parentheses, then click on Dynamic content, and select the appropriate Survey field:
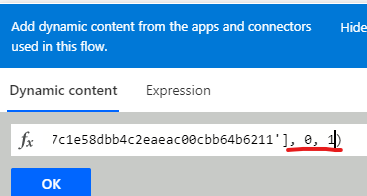
The final step to create this substring formula is to enter the remaining two parameters: 0 and 1, at the end, before the closing bracket:
You’ll need to now repeat this for the remaining List fields:
If you don’t have File Upload on your form, you can skip this step.
If there’s a file uploaded, we want to add it as an attachment to the SharePoint List. By default, it’s uploaded to OneDrive, so we have to copy it from there.
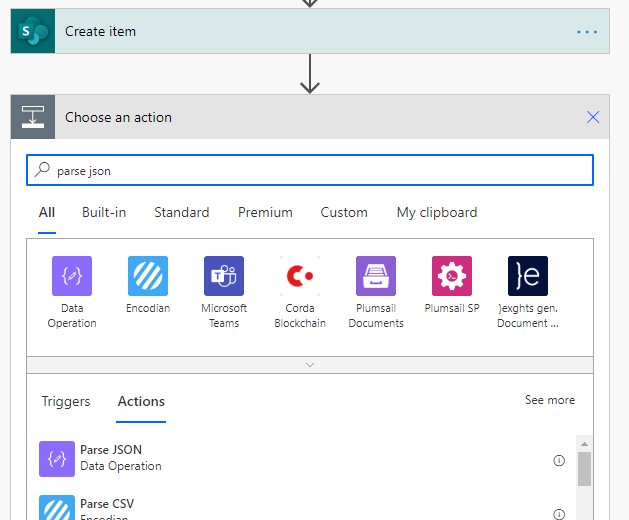
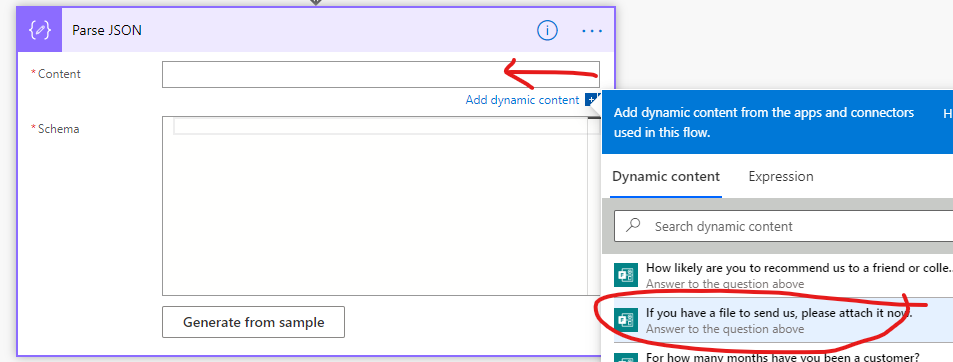
The first step is to add a Parse JSON step. This is required to grab the URL for the uploaded file:
In Content, select the file attachment field:
In the Schema text area, you can manually generate the schema by running the flow, grabbing the result that comes back, and generating it from a sample. Luckily I’ve done this. Just paste in the following Schema value:
{
    "type": "array",
    "items": {
        "type": "object",
        "properties": {
            "name": {
                "type": "string"
            },
            "link": {
                "type": "string"
            },
            "id": {
                "type": "string"
            },
            "type": {},
            "size": {
                "type": "integer"
            },
            "referenceId": {
                "type": "string"
            },
            "driveId": {
                "type": "string"
            },
            "status": {
                "type": "integer"
            },
            "uploadSessionUrl": {}
        },
        "required": [
            "name",
            "link",
            "id",
            "type",
            "size",
            "referenceId",
            "driveId",
            "status",
            "uploadSessionUrl"
        ]
    }
}
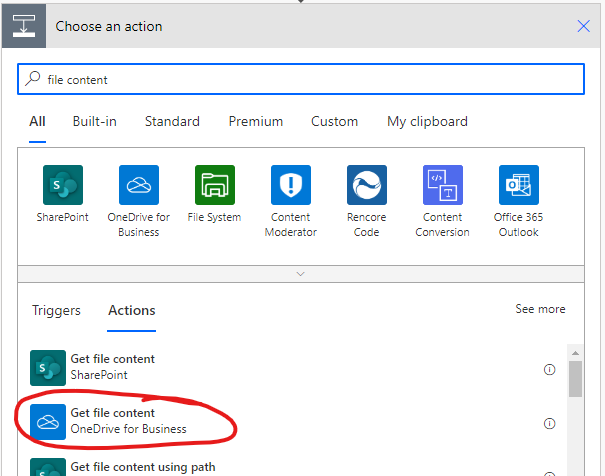
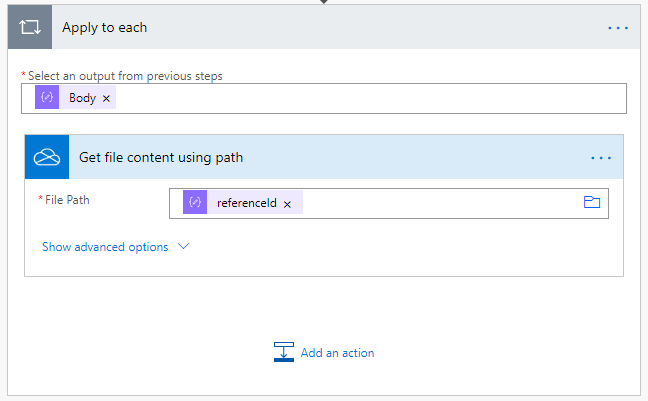
We’re now going to need to grab the file contents from OneDrive, looping round each uploaded file (even though there’s likely a maximum of one, there could also be zero).
Just paste in the above, and click New Step. type in OneDrive and select Get file content:
In the File field, select the driveId dynamic value. This is a value that’s generated in the Parse JSON step above. Then add a dot and then add the id dynamic value:
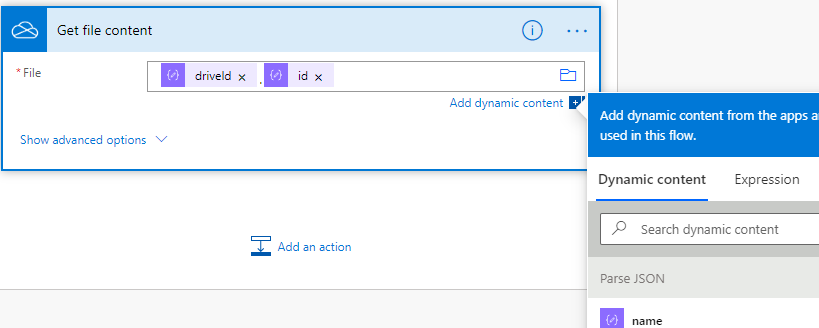
The step will automatically transform into a loop for you. This is normal, don’t panic!
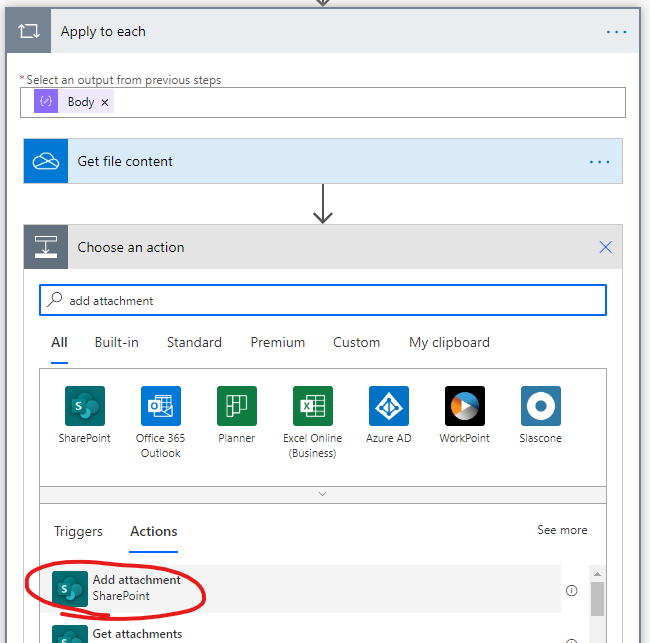
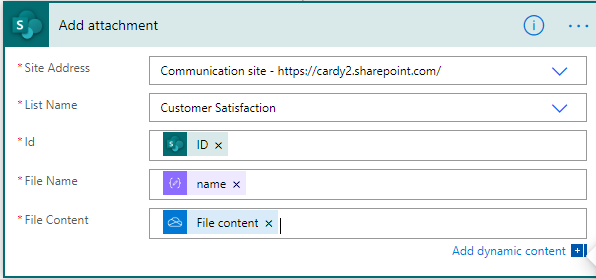
Inside the Apply to each box, click Add an action at the bottom, and select the SharePoint Add Attachment action:
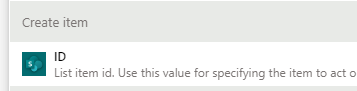
Fill in the details for the Add Attachment action. The ID should be the previously created List Item ID:
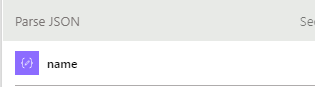
For File Name, select the name property from the Parse JSON step:
For the content, select the File content property from the OneDrive Get file content step:
It’s a good idea to test the flow to see if there are any issues. Make sure your Flow is saved, and go back to the Form. Click the Preview button at the top:
Fill in the form, and upload a file, if you have that option. Click Submit, and then jump to SharePoint, and wait for the item to arrive!

And in SharePoint……
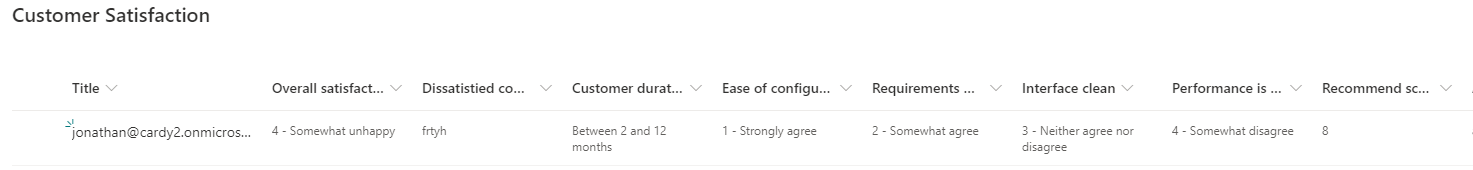
Success!
Of course, mine didn’t work first time. I had an error in my OneDrive step where I was retrieving the file content - initially, I attempted to use the ‘Retrieve file content’ step instead of ‘Retrieve file content using path’ step. I had to go back and edit this post to fix it. You’ll probably find you get an error at some point. Don’t panic, PowerAutomate will allow you to view the failed Flow and inspect the data to allow you to fix it.
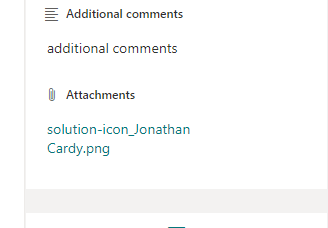
In order to see the file attachment, click the Ellipsis and select Details:
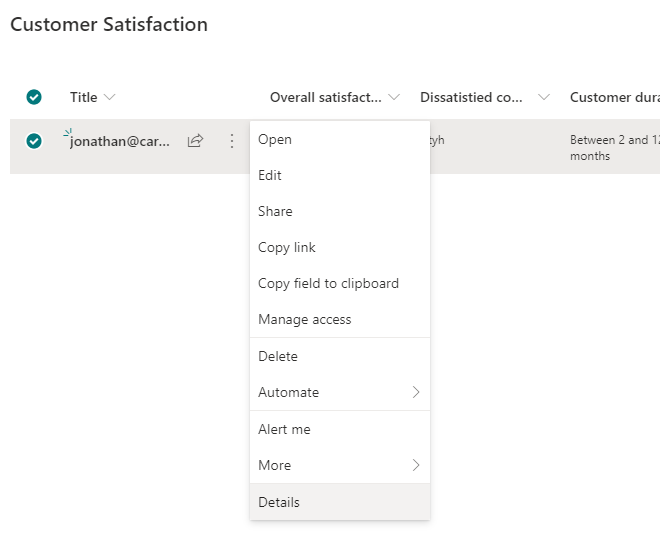
The attachment is there at the bottom of the properties:
The purpose of views is to be able to grab a subset of survey responses, for reporting. Here’s an outline of the Views we want to create:
Created > [Today]-30)To create a view containing a filter, you need to go into List Settings, and click on Views. Then click on Create. Once you do this, scroll down to the Filter section.
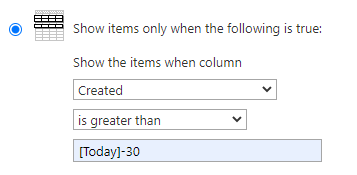
Enter the formula as above, and click Create.
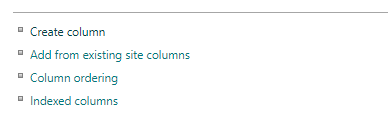
To improve performance and help guard against scalability issues (when the list view threshold is met), you should index your columns. Go into List Settings, then select Indexed columns:
Add your fields to the index:
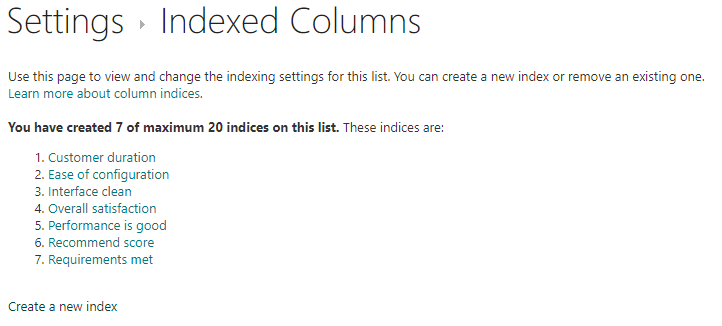
Only fields you wish to actually query on need to be indexed. Only lists with >5000 items require an index. SharePoint Modern Lists automatically create indices in these scenarios, but I like to manually create them anyway - just in case.
Before we move on to the data analysis/charting configuration, it’s a good idea to add some test data. Just go ahead and fill in your Form. Make sure to fill every field. Occasionally, leave the non-mandatory fields blank. Try to emulate what you think a user might do - this step doubles as a testing process.
Before moving on, make sure you have at least 10-20 responses to be able to render some charts:
This is easily the most satisfying part of the process - watching the data come together in a visualisation!
Some of the visualisations we want to see are:
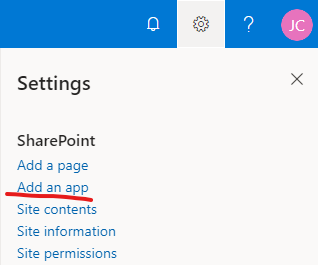
You’ll need the 365Automate chart solution installed. To do that, click on Settings, then Add an app:
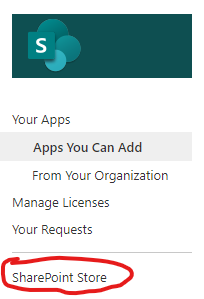
Open the SharePoint Store:
Search for 365Automate and install the app.
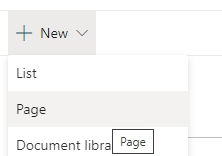
Next, start by creating a blank Modern page in SharePoint:
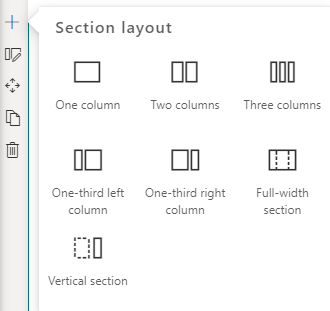
We’re going to use a page layout with 3 horizontal sections: a 3-column section, a 2-column section, and a full-width section. Click the + sign on the left of the page to add the sections:
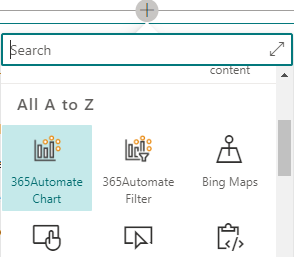
To add a chart to a section, click the + sign within that section, and add the 365Automate Chart web part:
The web parts are configured as follows;
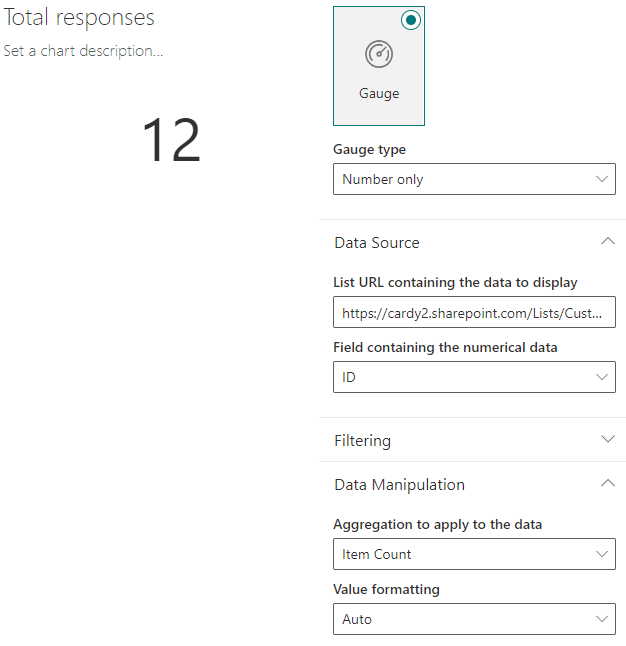
This is a Gauge, configured as follows:
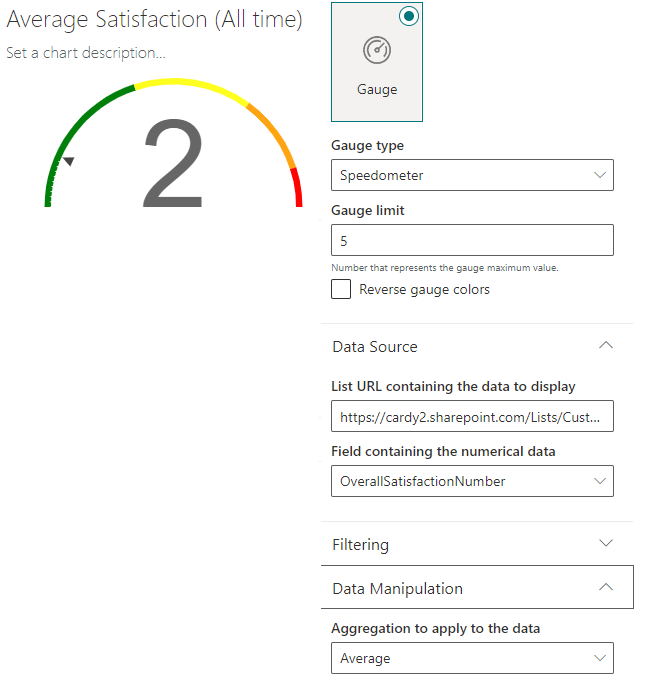
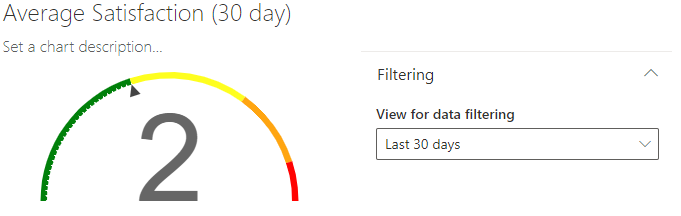
This is also a Gauge, but configured slightly differently to select an Average score:
This is the same as the above, but the Last 30 days view is selected:
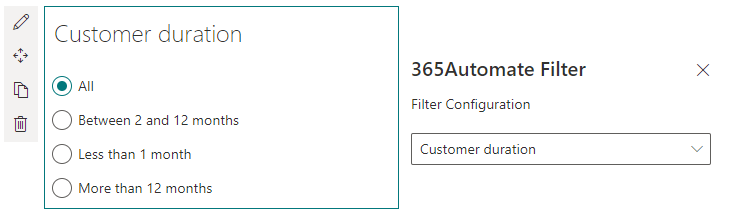
This is a filter web part. These are incredibly simple, yet powerful. You can select a customer duration, and it’ll filter all the charts on the page. It’s simply configured as follows, by selecting the field which is being used for filtering:
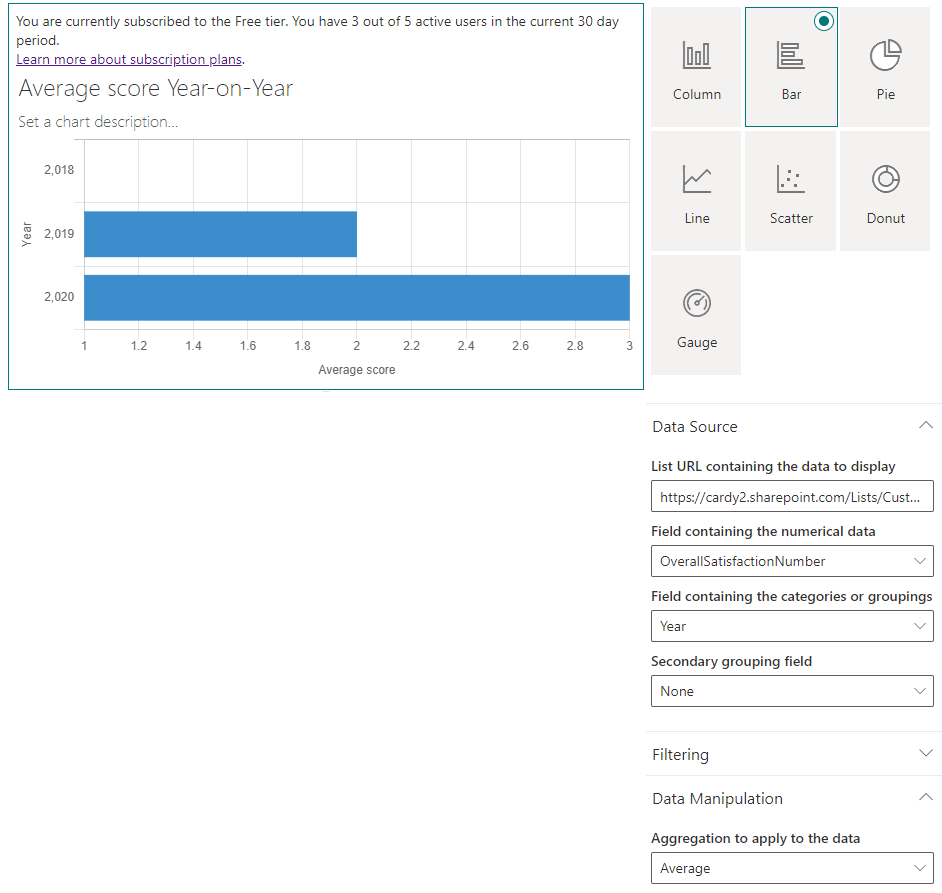
This bar chart shows the average score, grouped by Year. It’s configured as follows:
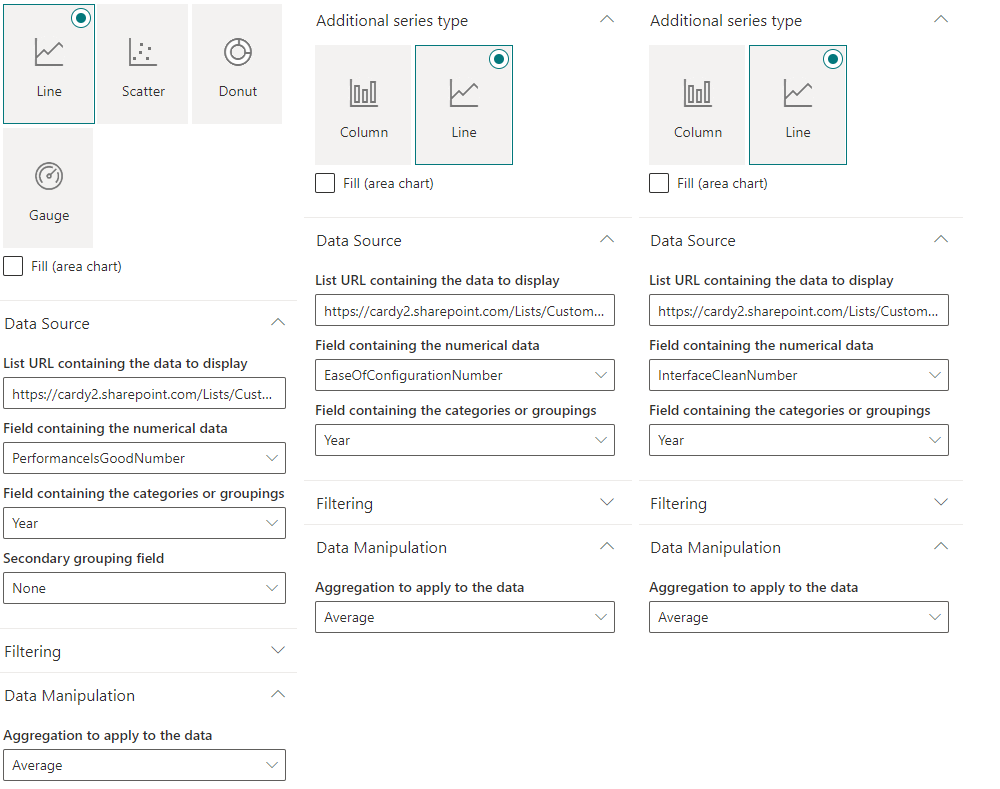
This is a line chart showing how the different customer feedback values change each year:
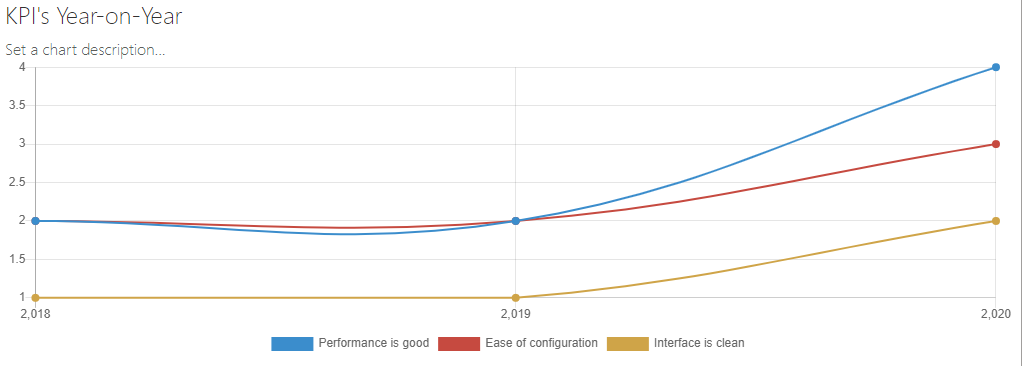
It’s configured as follows. Note that each series is added separately using the navigational buttons at the bottom of the configuration pane. Each looks like this:
Hopefully this is a good guide to configuring a powerful end-to-end solution for data gathering, customer feedback, and KPI analysis.
Of course I would say this, but I think the highlight is the simplicity with which a great dashboard can be created at the end of the process - literally within minutes. Maintenance of the dashboard can be carried out by business users as time goes on. It can be shared with users without incurring additional cost.
Please get in touch if you’d like any assistance with setting up your data analysis solution. Don’t hesitate to get started with the 365Automate solution!. Just go to your Site Contents - click Add an App - and search for 365Automate.