
Board View is a new type of List view that groups list items into visual ‘buckets’ and allows you to drag-and-drop between them, very similar to Microsoft Planner:
It’s now the end of January and one of my test tenants has Board View enabled, but the other doesn’t, but apparently it’ll be available everywhere very soon.
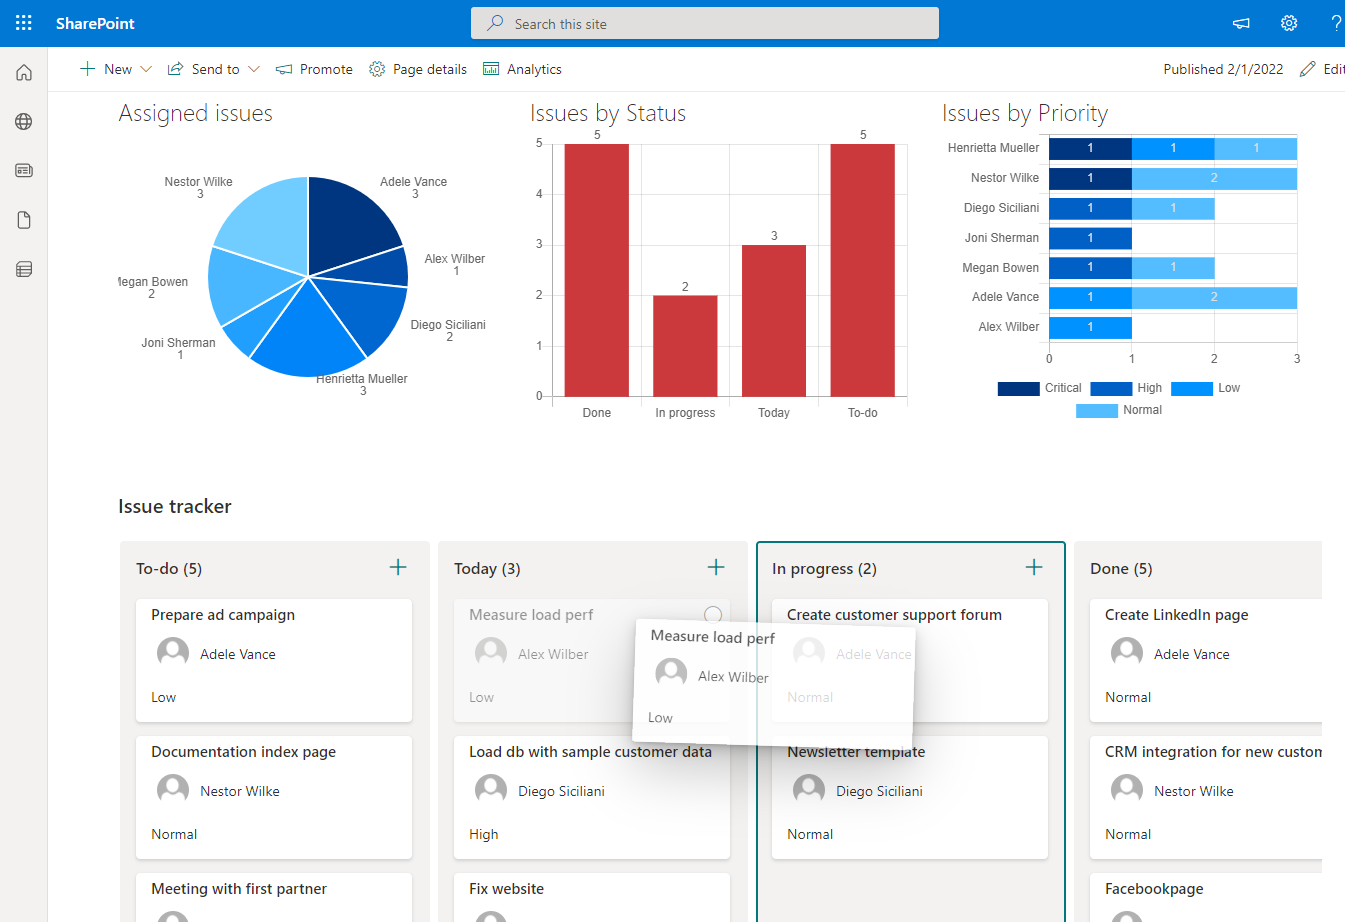
This post consists of two parts: firstly, configuring the out of the box Board View configuration. Secondly, combining Board View with the ListBurst Charts product in a page to product a visually appealing, fully featured dashboard. Here’s the eventual outcome:
In my case, I created a new List from the Issue tracker template, but within any list - old or new - just select the option to add a new view.
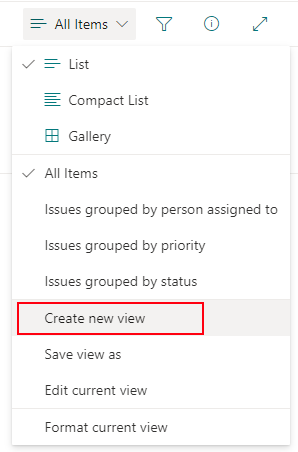
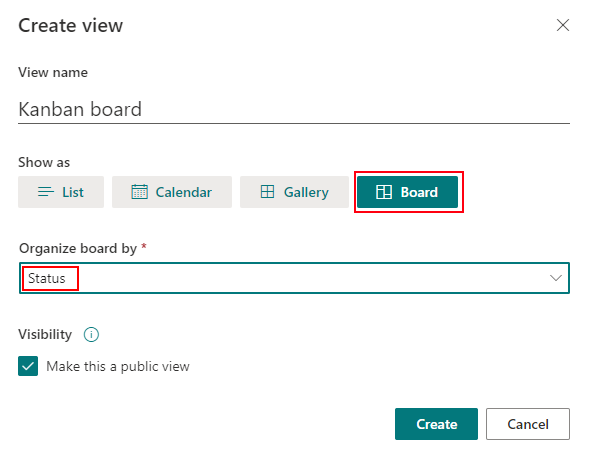
You’ll see a new button for “Board View”. Select that, and then choose the column that you want to use for your buckets:
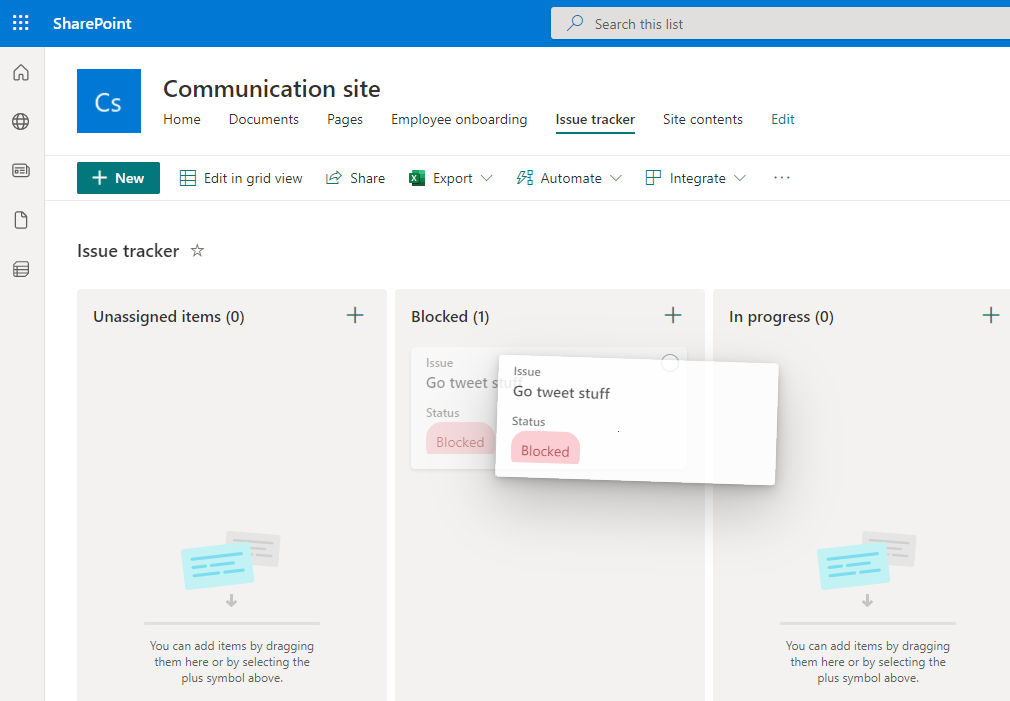
Hooray! You now have a Kanban board using all the in-built flexibility of Microsoft Lists!
Dragging and dropping works like you’d expect - you can move items easily between buckets, and it’ll automatically update the item’s field as appropriate. In my case, that’s the Status column.
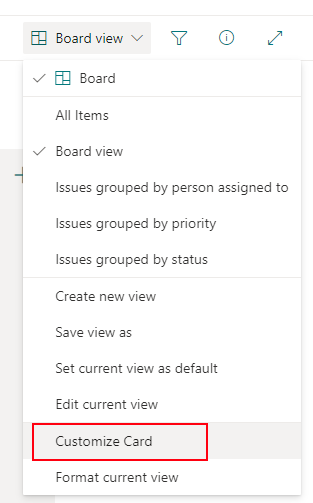
Here’s how to customise the appearance of each card/item. Click the view name and select Customize Card:
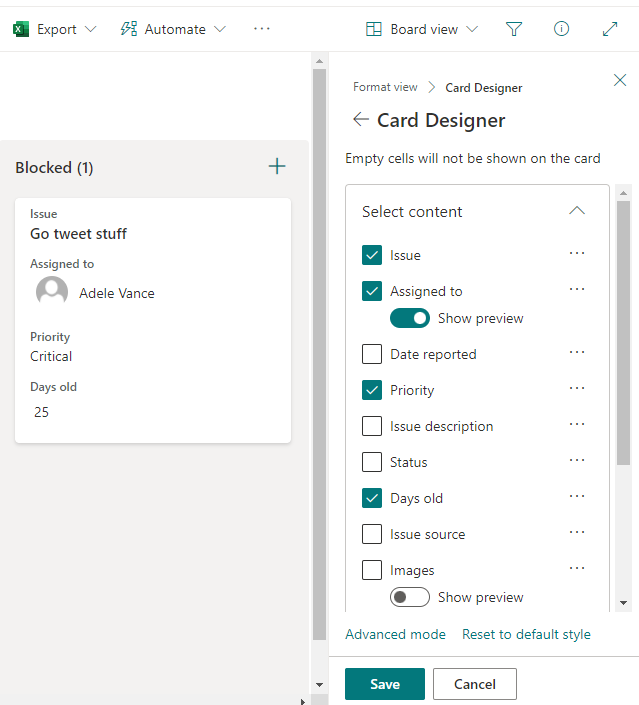
You’ll see a Card Designer pane which allows you to select the fields to display, and reorder them easily:
Something you may wish to do at this point is set the Board View as the default view. You can do this under List settings > click your view > Tick ‘Make this the default view’. That’s it done. Proceed to the next section to extend this to a dashboard.
So you want to add some charts to your issue tracker/project management Kanban board. To do this, you’ll have to install ListBurst.
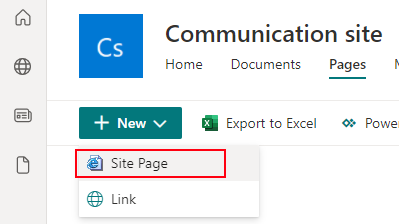
The first thing we will want to do is add the List into a page. Under Pages, click New > Site Page.
Within the new page, add the List webpart, and select your new List:
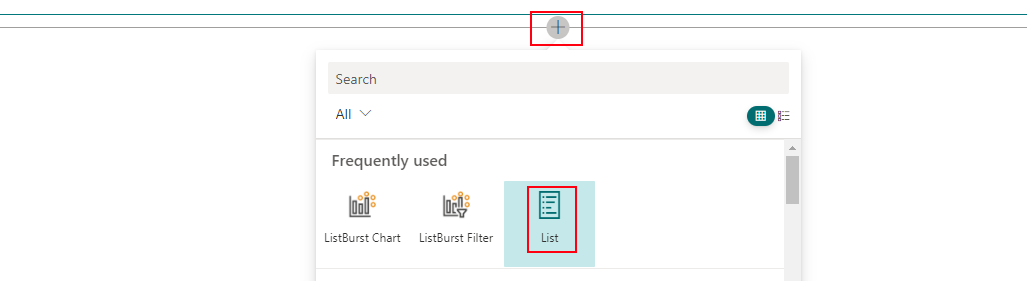
When you’ve added the web part, and selected your list, it’ll be embedded within the page.
At this stage, you can add some more sections to put charts into. The ListBurst charts product comes with a 30 day free trial - install it and you can add charts to illustrate the data in any SharePoint list to produce dashboards that will delight your users. The dashboard at the start of this post contains 3 charts will take less than 5 minutes to configure. Head on over to the documentation to get started….
And here’s the dashboard once again